The San Mateo Daily Journal
The San Mateo Daily Journal
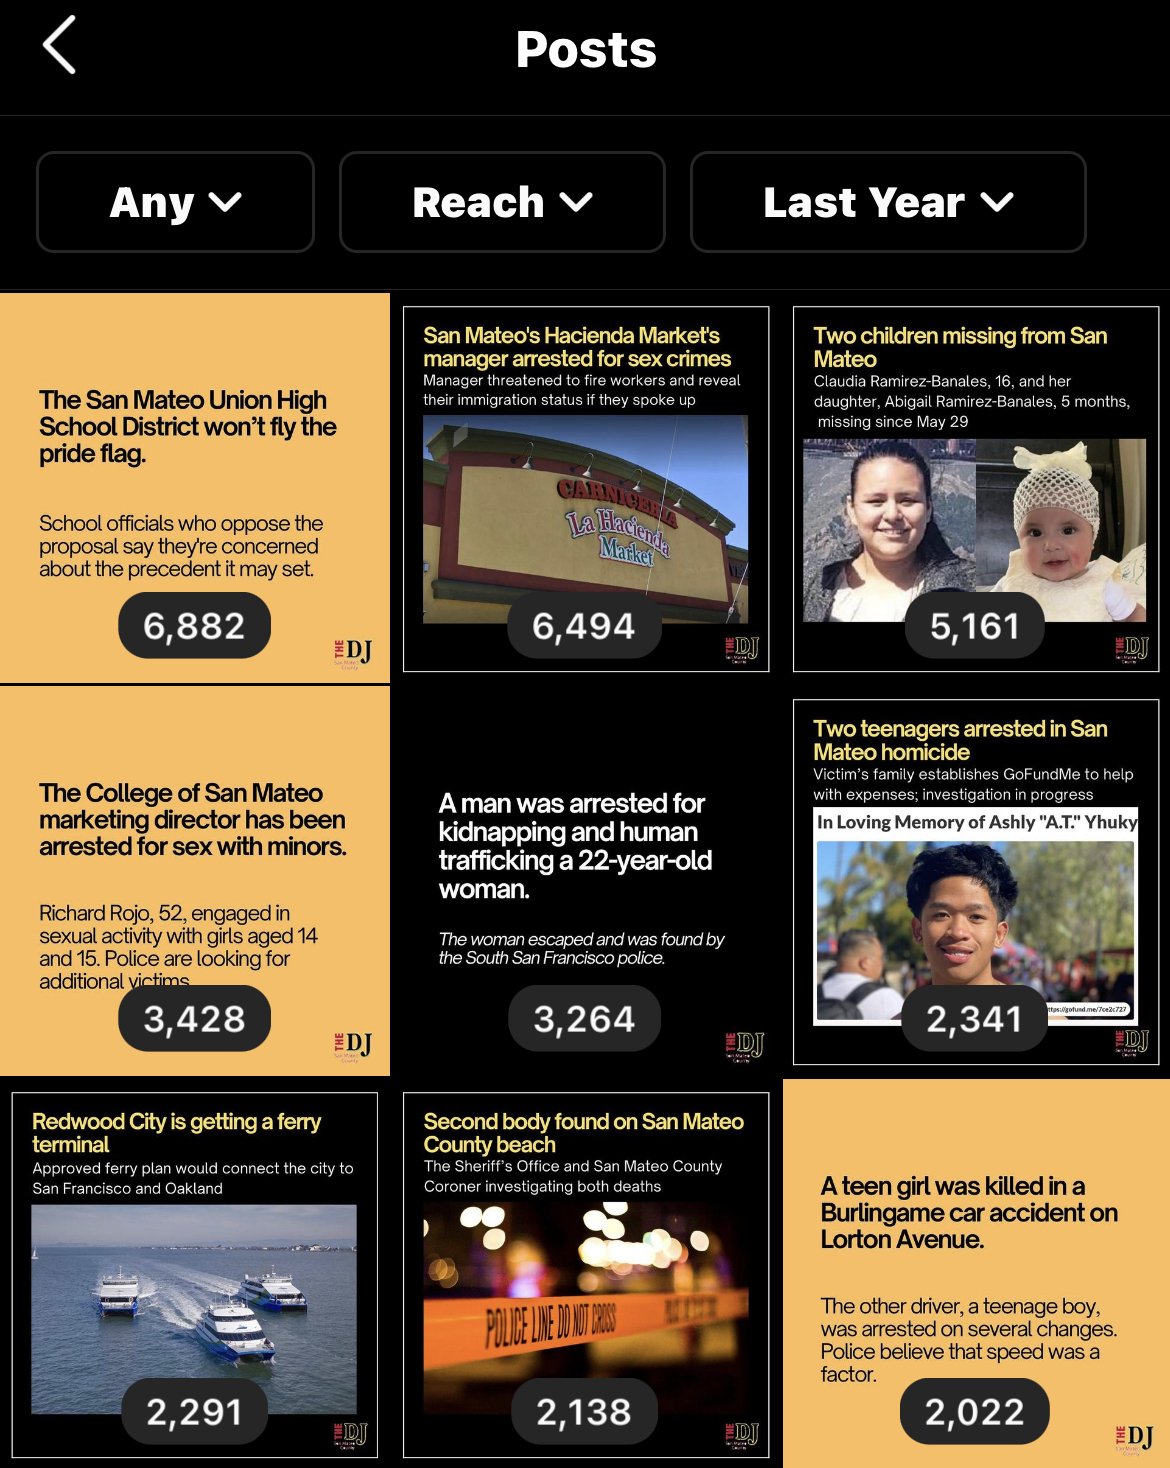
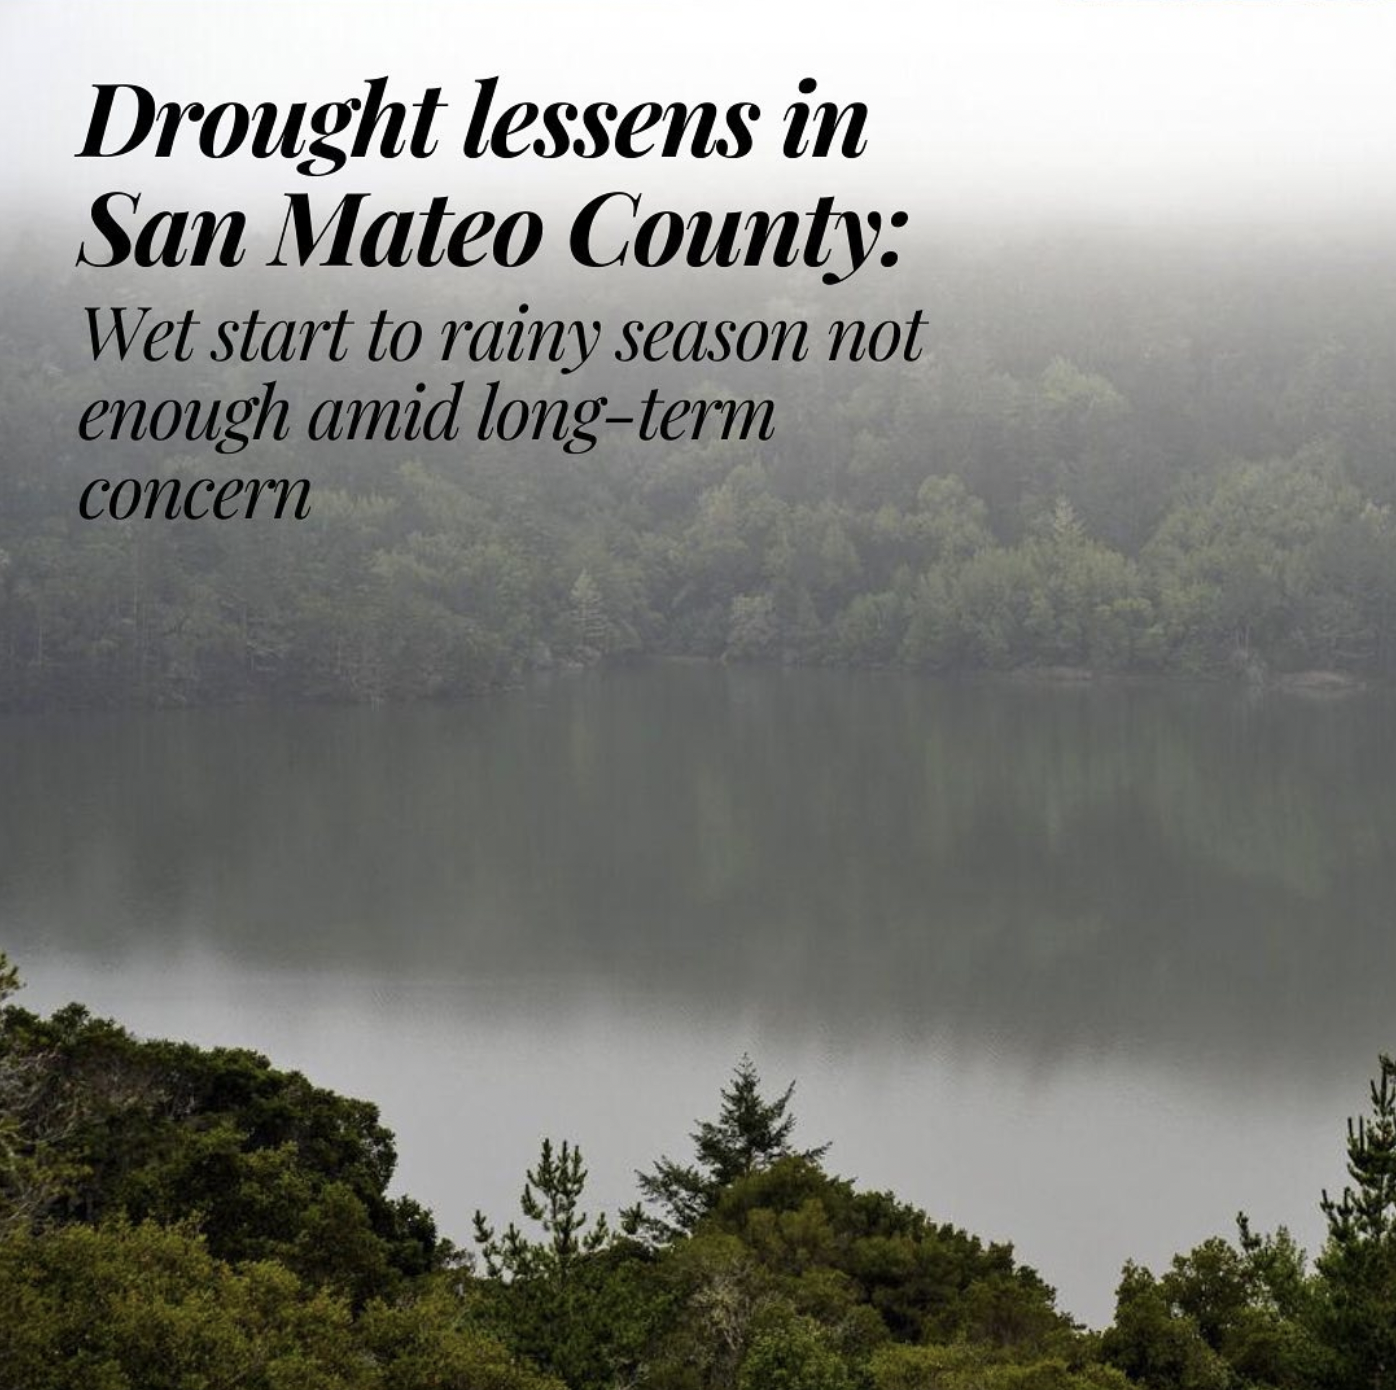
As a social media and marketing intern for the San Mateo Daily journal, I am was charge of their official Instagram account. Each day, I created 1-3 posts to publish on the account and keep users engaged with local news. After taking charge of the account, I created posts appealing to a more diverse audience, which helped boost their following by 24% over six months.

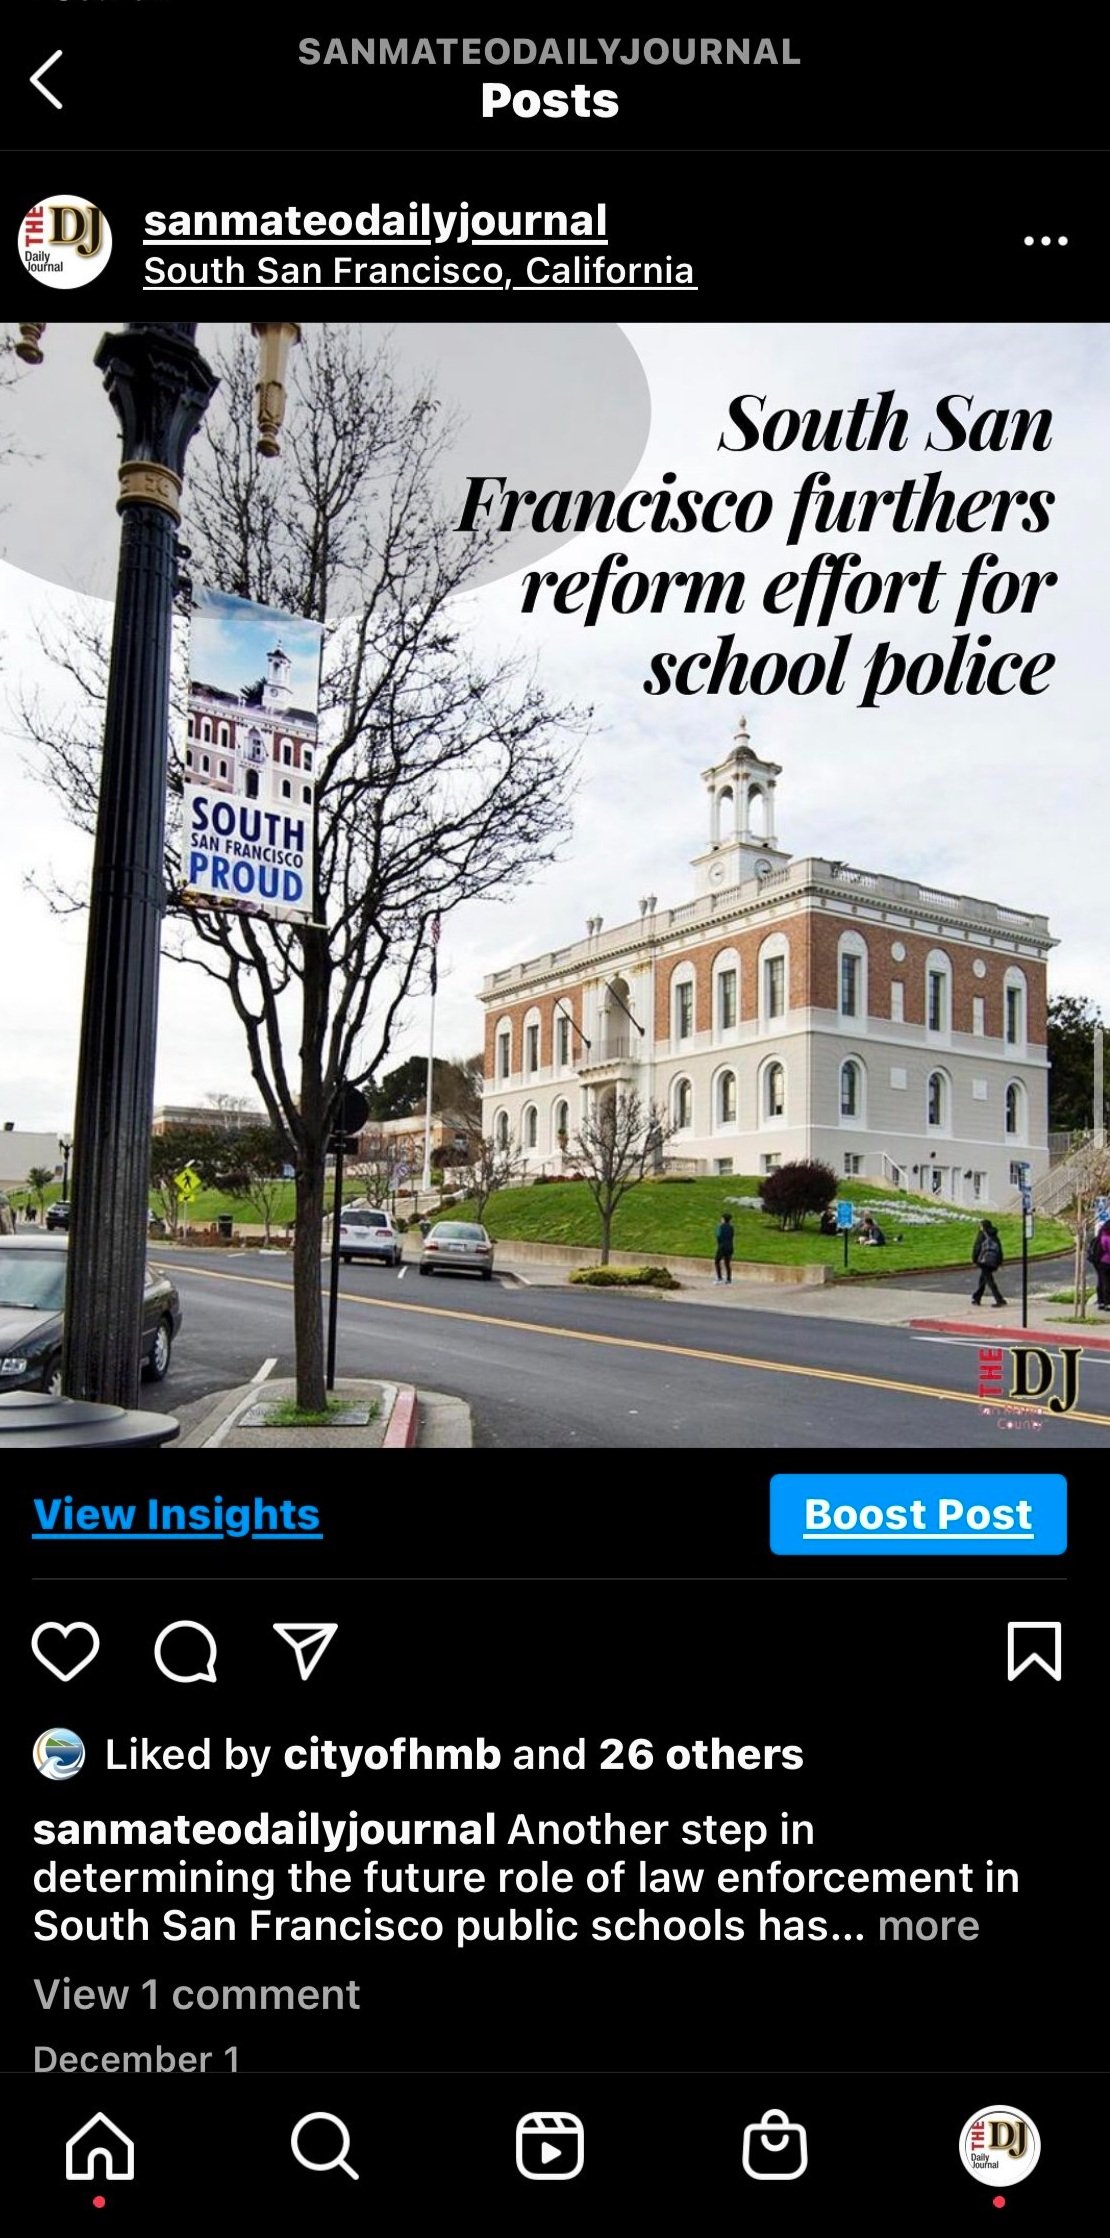
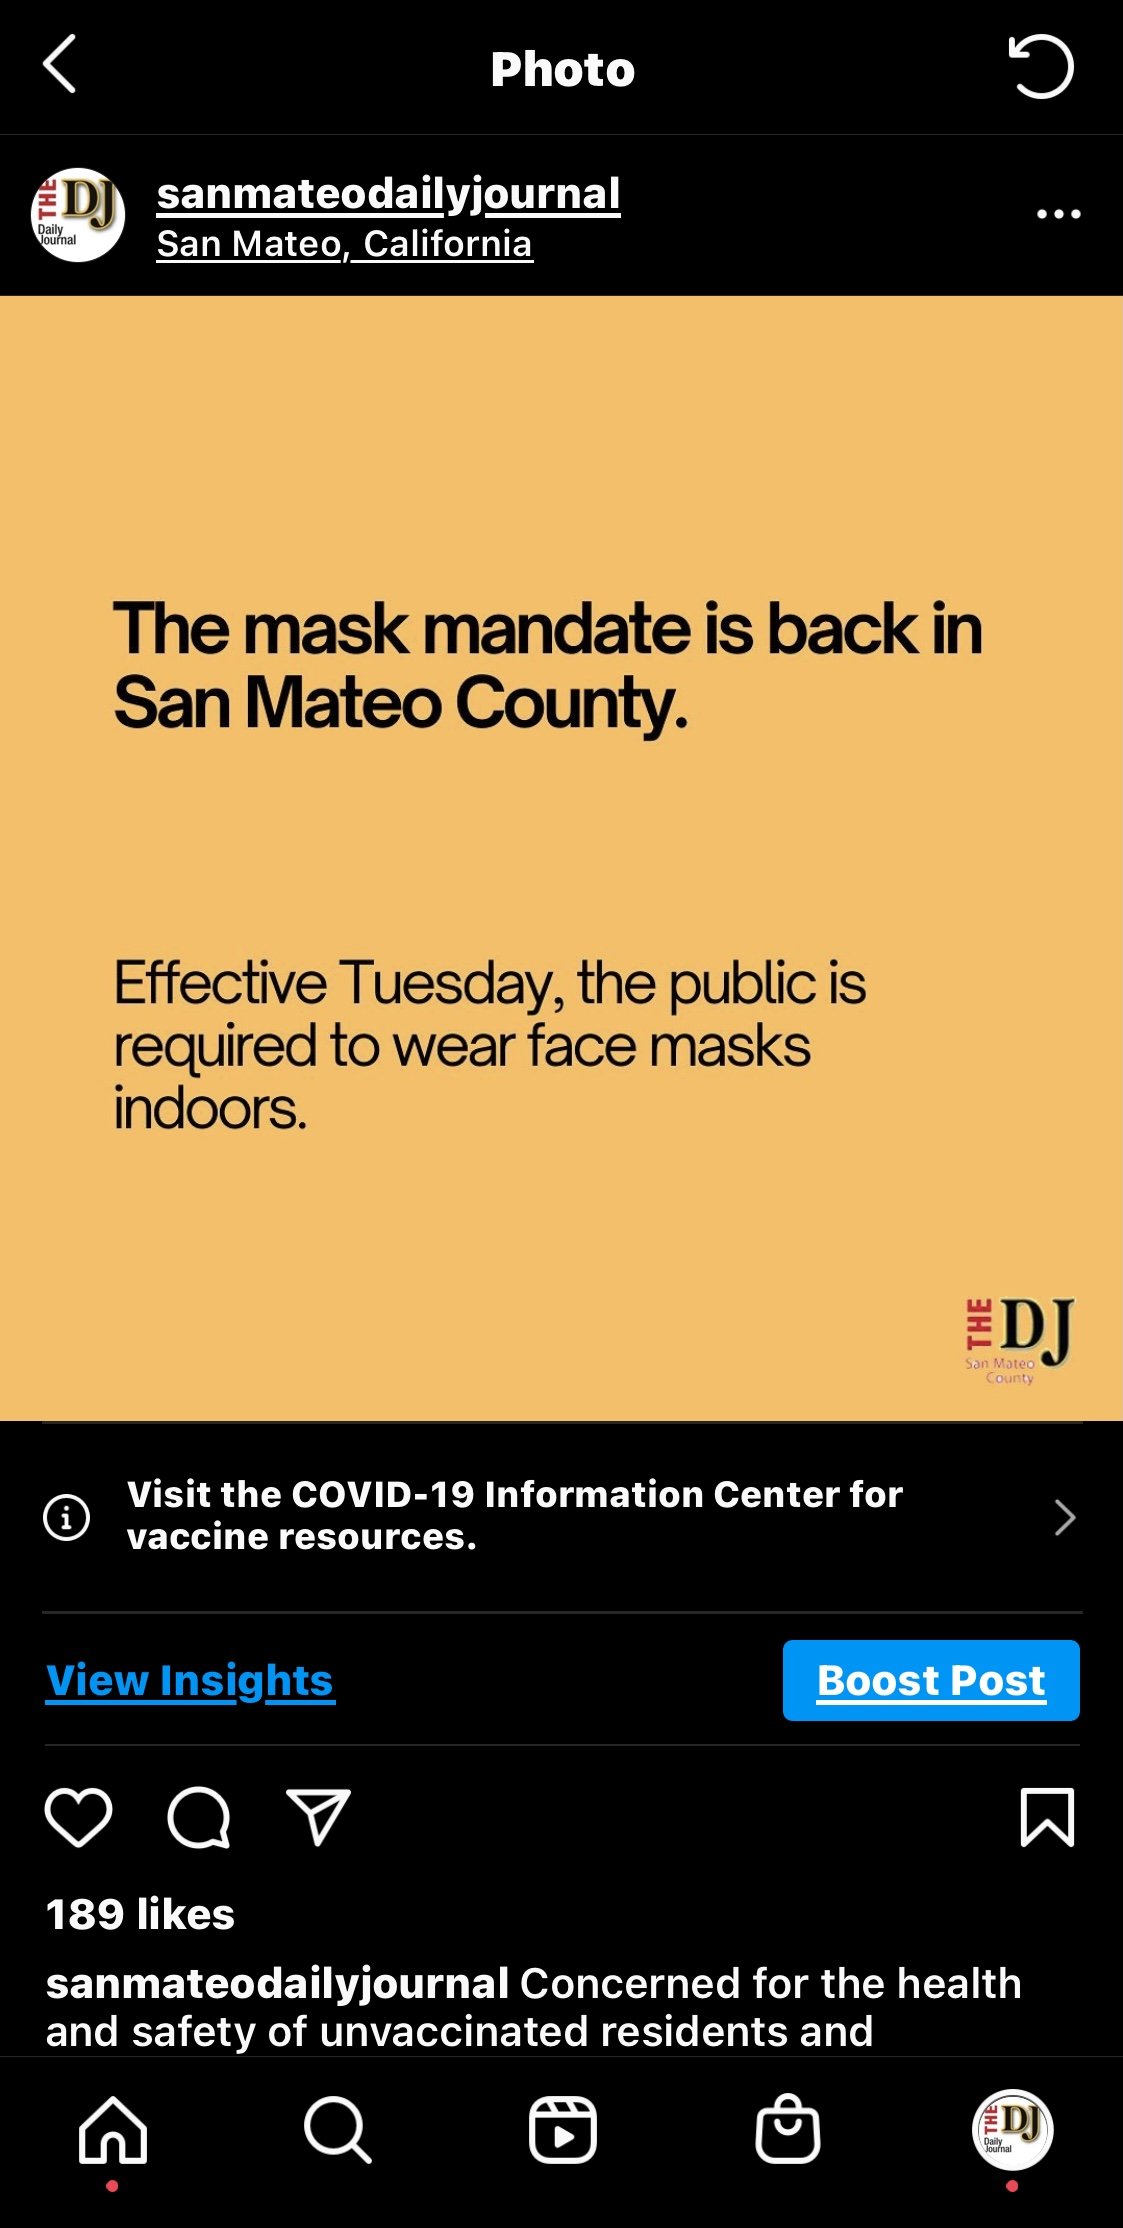
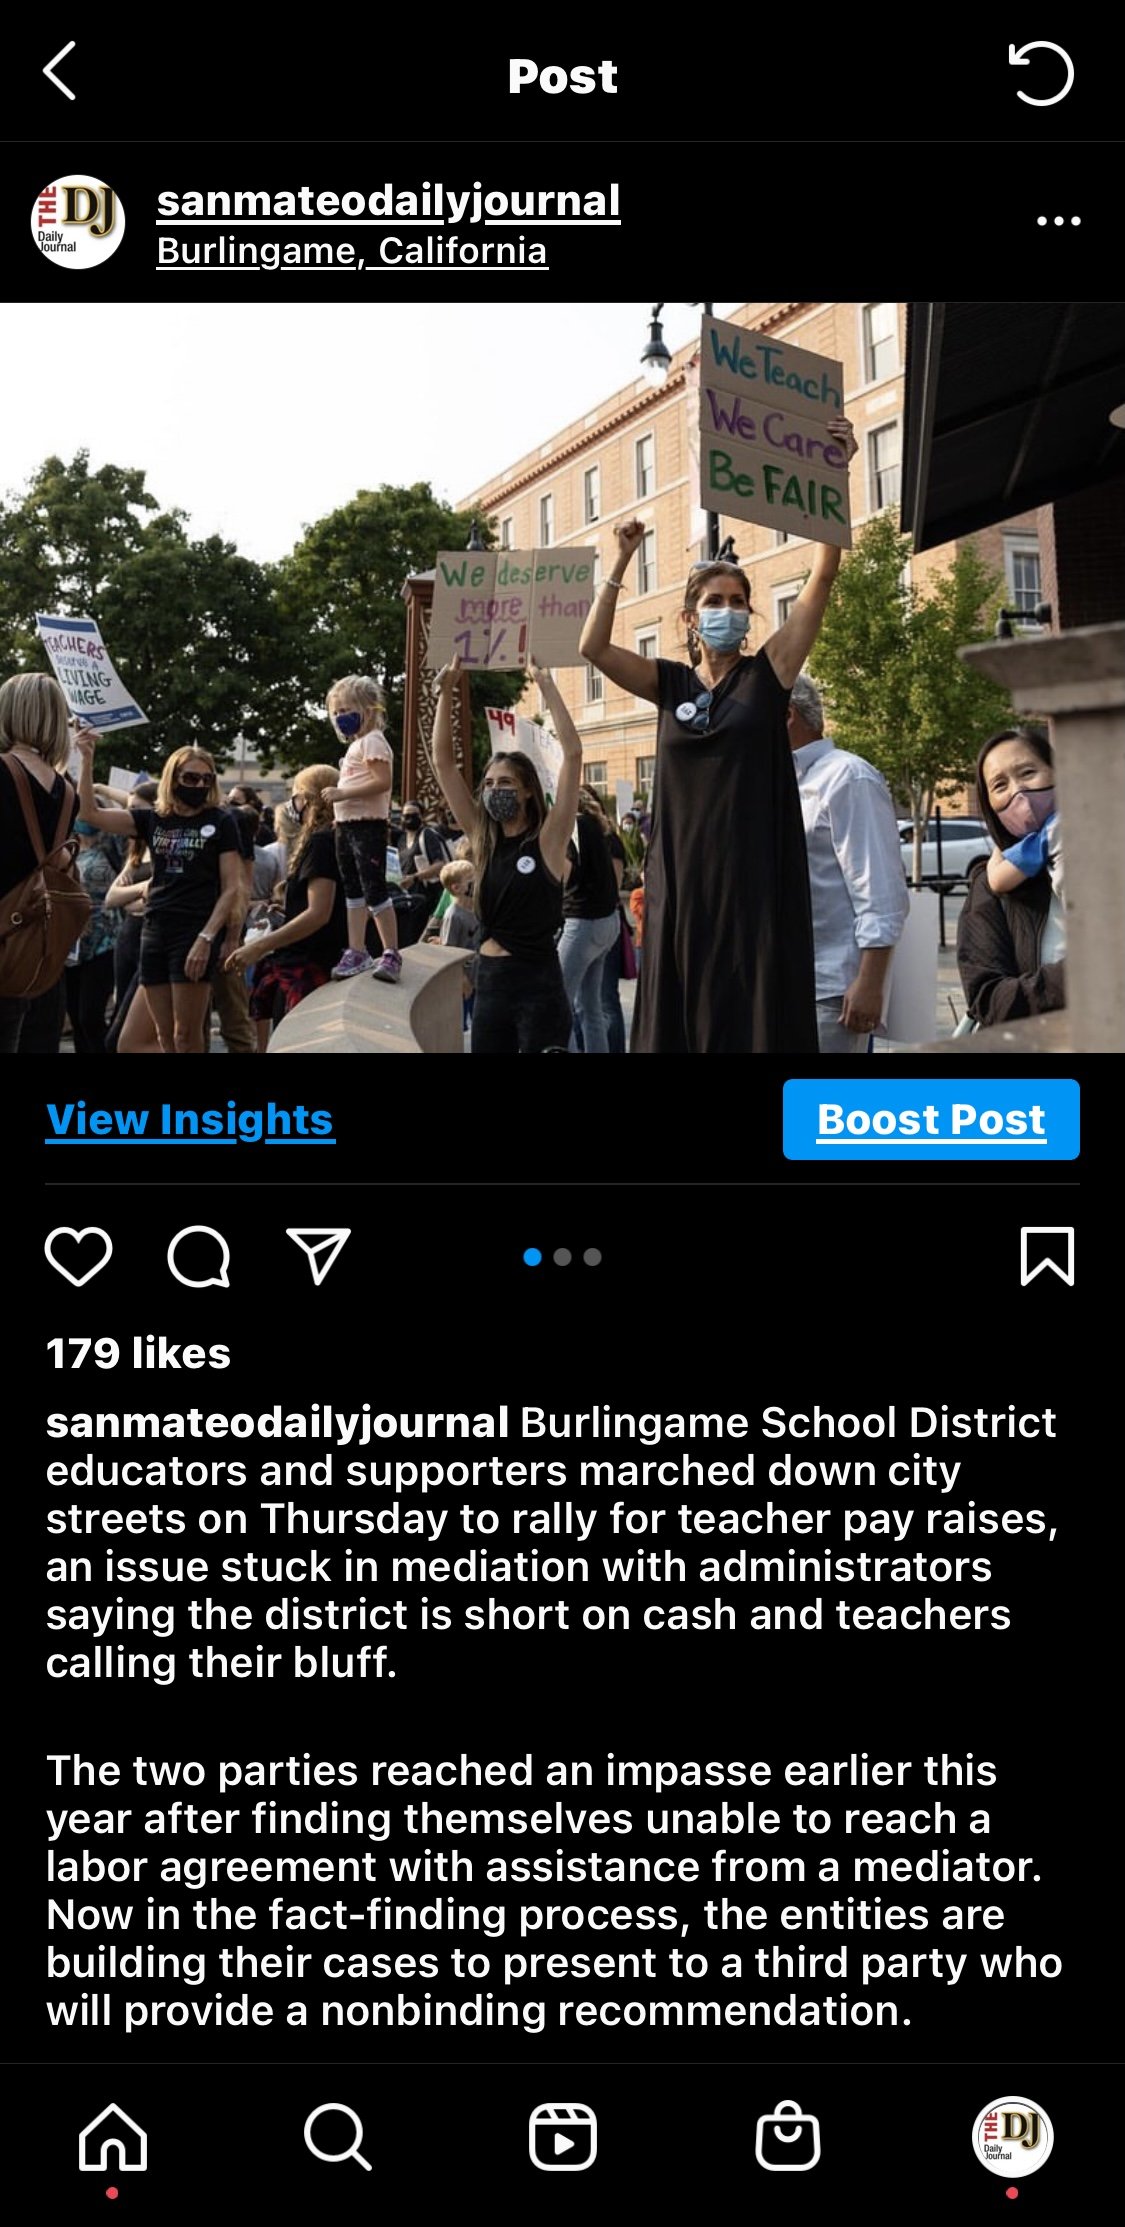


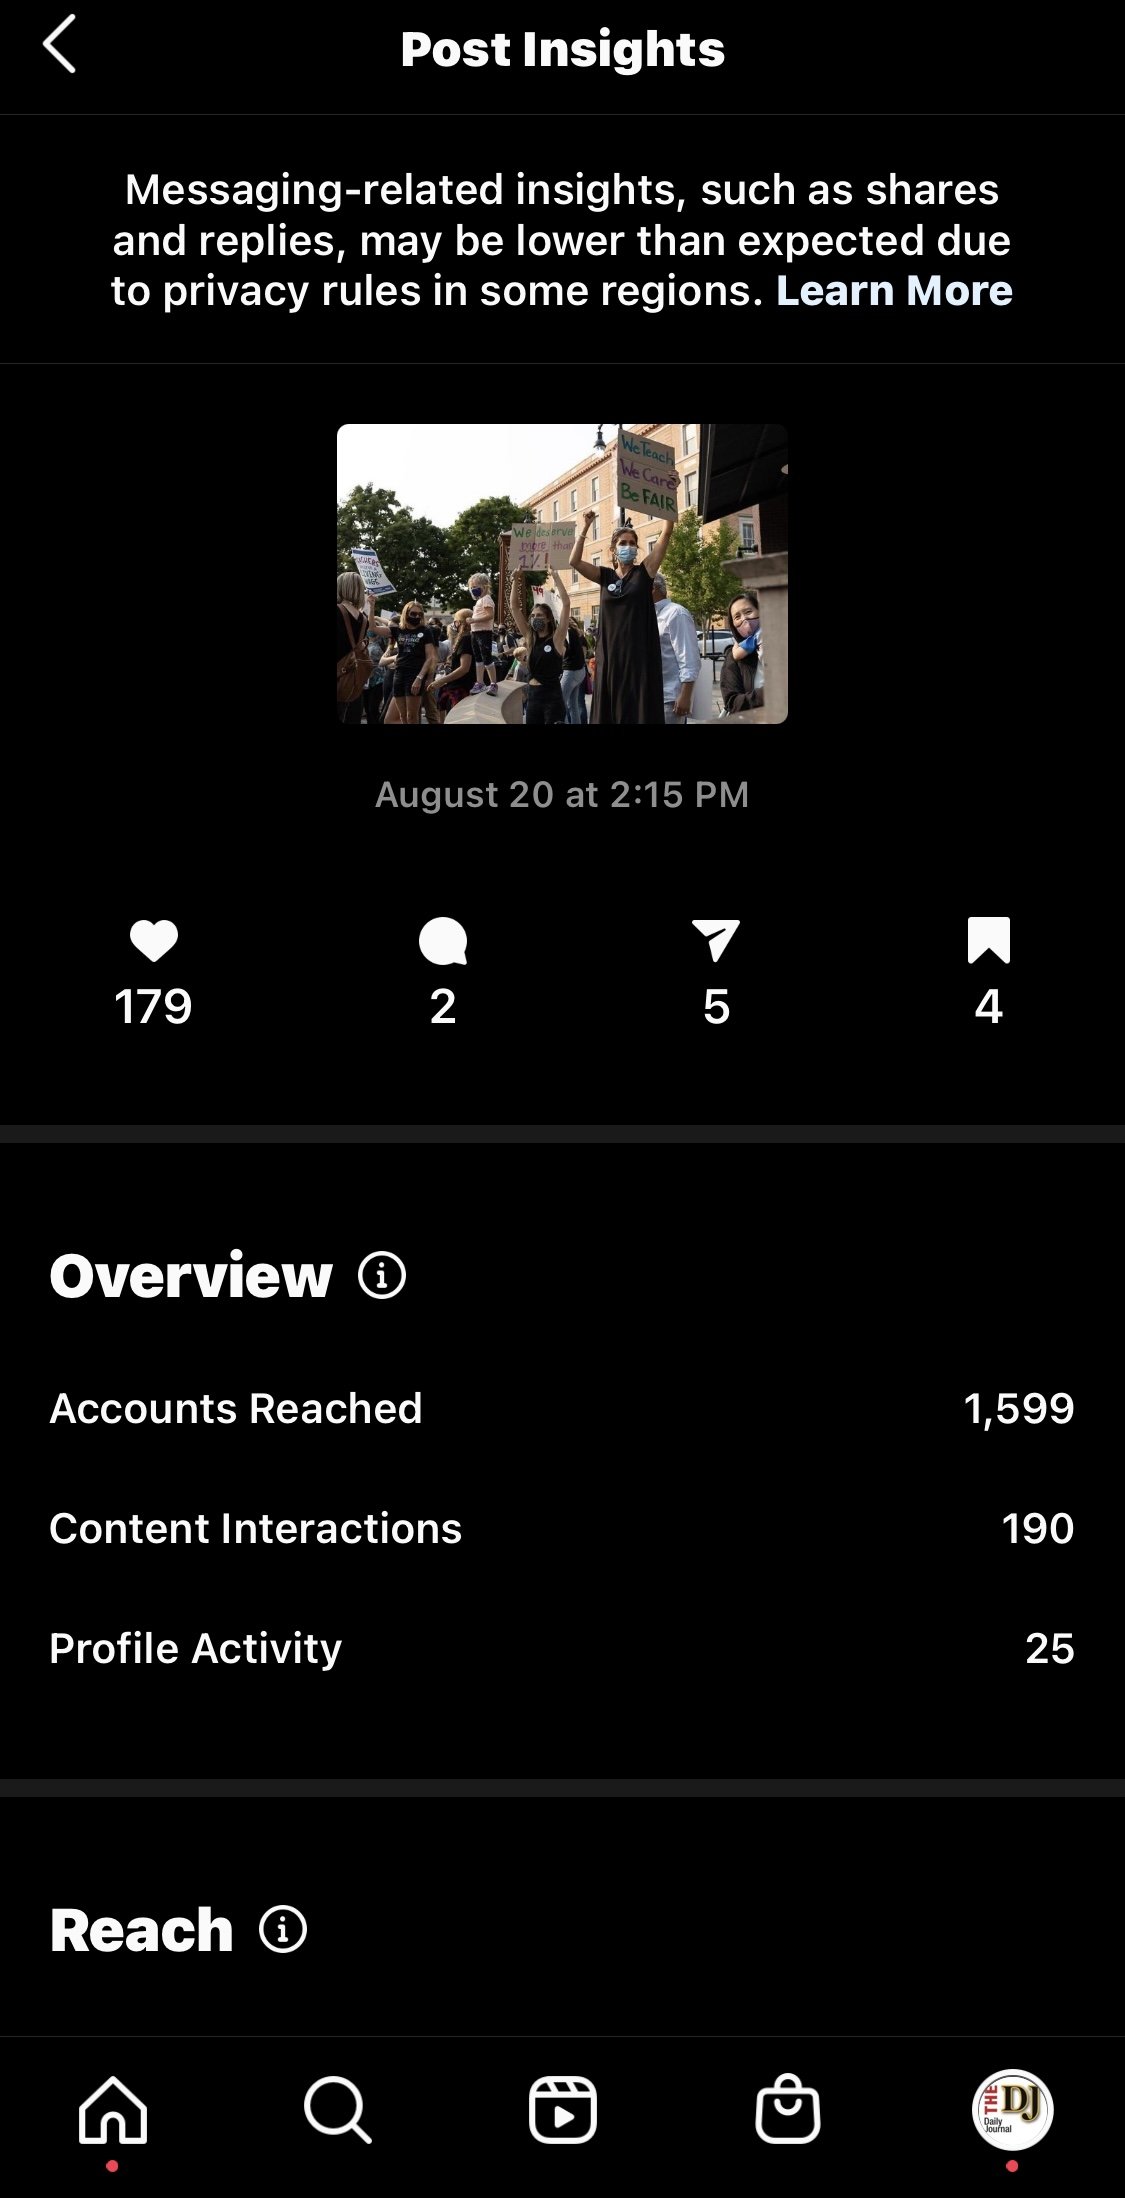
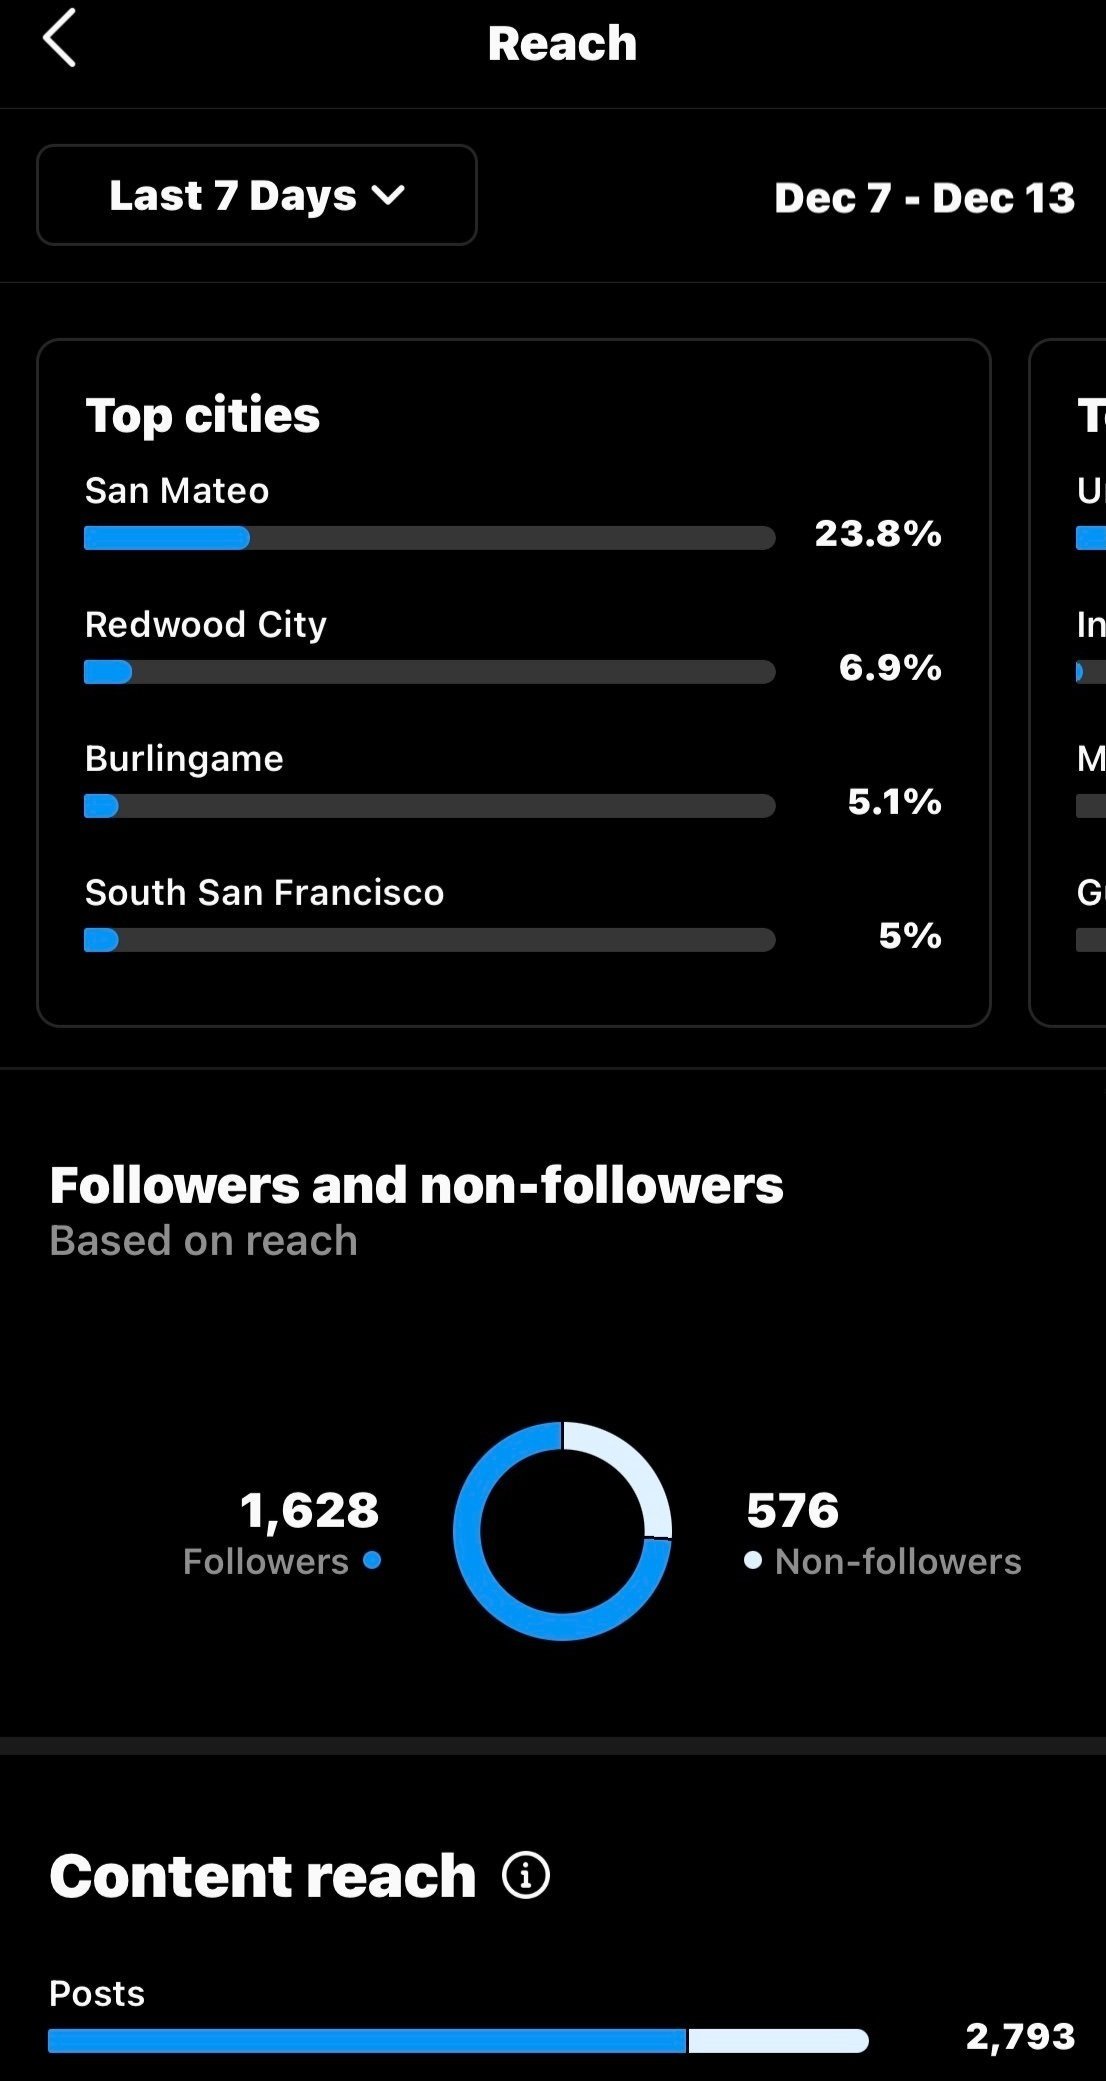
Through various Instagram posts, I covered major local news stories for each day. The snippets of information in the graphic portion of each post told users what to expect from the information in each article.
INSTAGRAM FEED
Below are examples of each post format. Each caption includes a snippet of the article the post covered and encourages users to use our link to the SMDJ website to read the full story. By completing the Instagram-feed makeover, I witnessed our following count and user engagement increase dramatically.
INSTAGRAM STORIES
When the Instagram account was handed over to me, I noticed a weak spot of our engagement was the Daily Journal’s Instagram stories. Although there were frequent posts referencing local news or sports articles written for that day, many users found it difficult to find the full stories in the site. With that, I decided to take advantage of the new linking feature in Instagram stories and focus on creating visually appealing graphics. Below are examples of various story posts—feel free to explore more of my experience in social media design here.

